HELP
What is HGTree v2.0?
Previous HGTree (HGTree v1.0) is a database that provides horizontal gene transfer (HGT) event information of 2,472 prokaryote genomes using the tree reconciliation method. After opened HGTree v1.0, a large number of prokaryotic genomes have been additionally published. To cope with the rapid rise of prokaryotic genome data, we present HGTree v2.0, a newly updated version of our HGT database with much more extensive data, including a total of 20,536 completely sequenced prokaryotic genomes, and more reliable results curated with various steps. HGTree v2.0 has a set of expanded data results of putative horizontally transferred genes integrated with additional functional information such as KEGG pathway, virulence factor, and antimicrobial resistance. Furthermore, various visualization tools in the HGTree v2.0 database website will provide intuitive insights, allowing the users to investigate their genomes of interest.
Work process of HGTree v2.0

Tutorial of HGTree v2.0
Browse
Browse menu provides information about all HGT events for each genome, as well as shows their relationship with other orthologous genes in the total microbial genome. HGT Browser enables researchers to display and browse HGT information of complete genomes with data including gene function, COG, pfam, Virulence factor, Antimicrobial resistance gene, HGT relationships, gene cluster, and the phylogenetic tree of its orthologous genes.

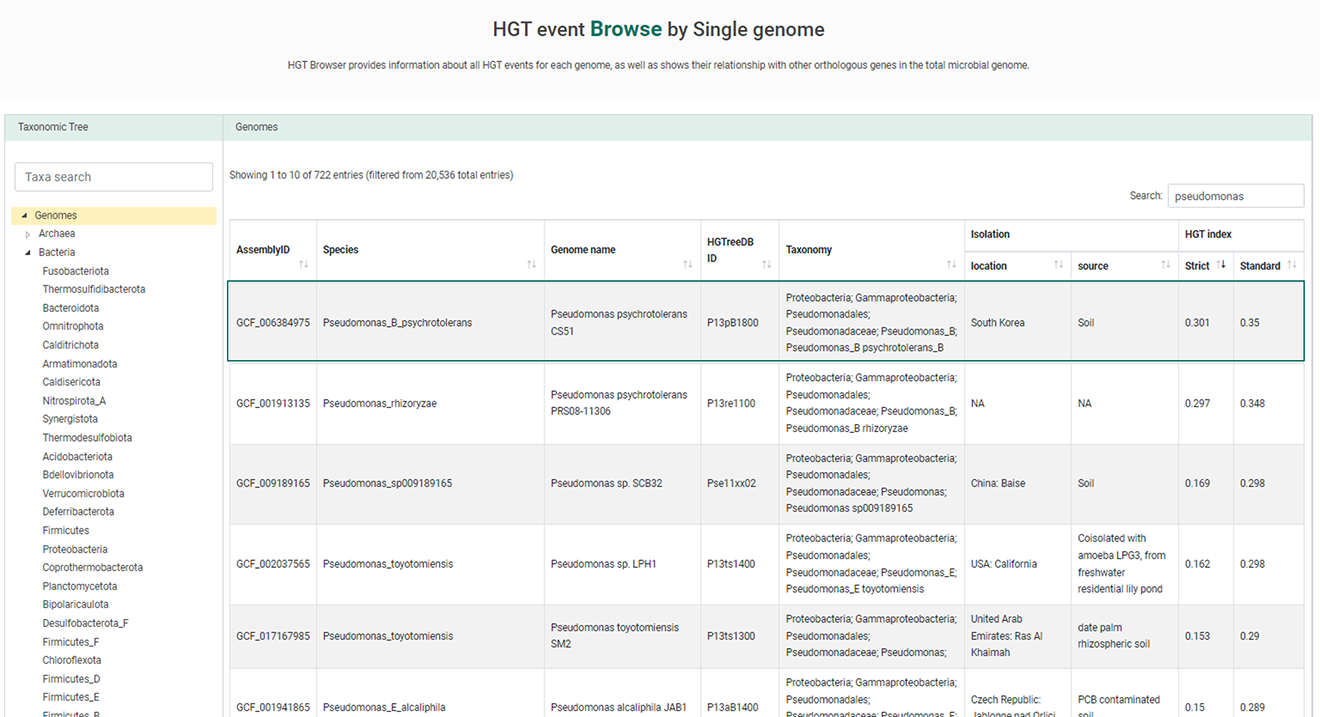
1. Selected the single genome of your interest.

2. When users select a genome of interest, “summary page” will be displayed including “Number of HGT genes”, and “Genus involved in HGT event”.

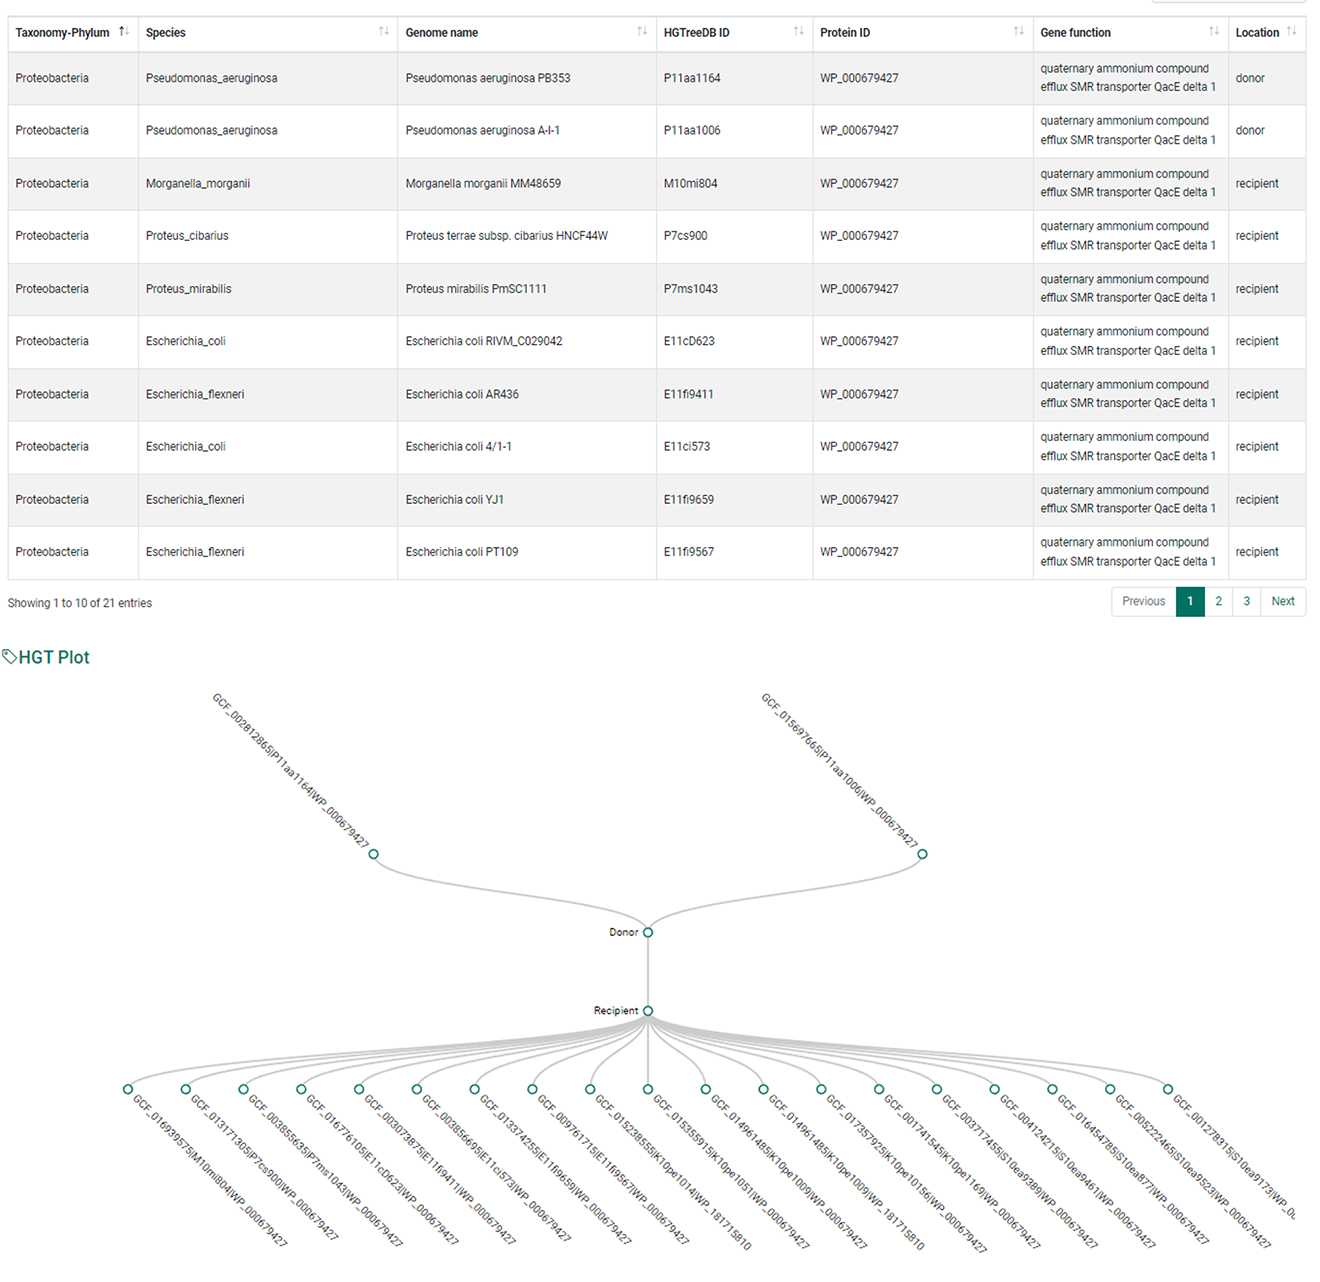
3. In detail view, all estimated HGT events will be displayed including protein ID, gene function, strict method or standard method, COG ID, pfam ID, virulence factor (VF), antimicrobial resistance gene (AMR). Click the row to see a graphical representation of all HGT relationships, including a selected gene.

4. In overview tab, Users can obtain information about a gene which they selected, and table above will contain basic information about all genes which have participated in HGT events. Also, a plot is generated which displays donors and recipients in each horizontal gene transfer event.

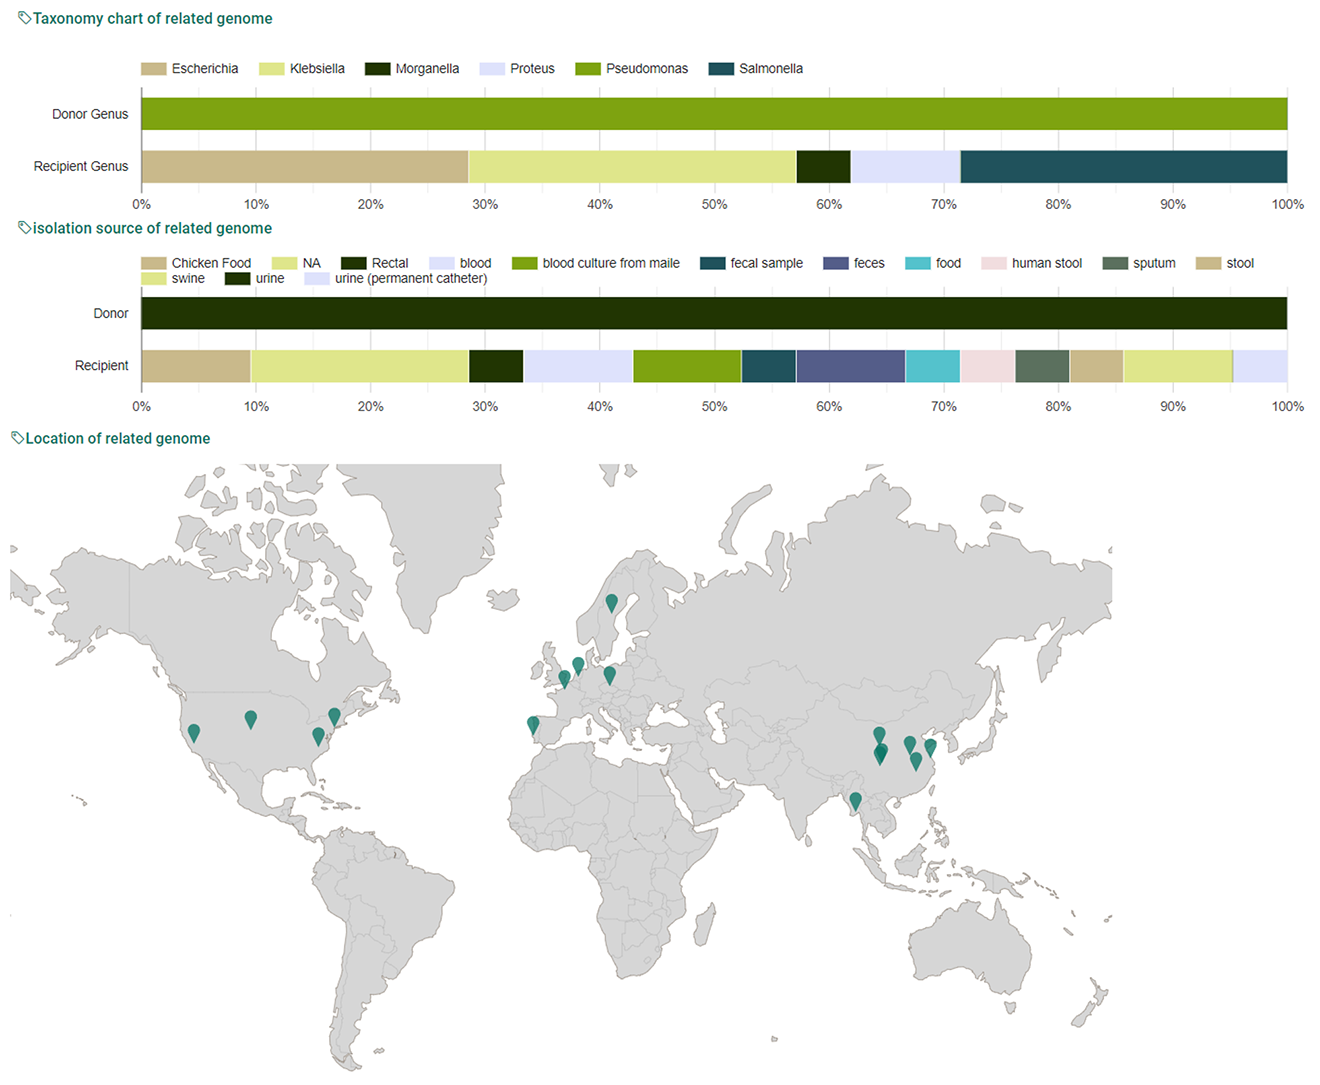
5. In meta tab, Users can obtain information about metadata such as taxonomy chart, isolation source chart, map of isolation location about all genomes which have participated in HGT events.
Search
The search menu provide information about HGT events which occurred only within a selected genomes or taxa of interested. To run this analysis, user must choose at least two different species or phyla. Also, user could search HGT events involving user sequence.
-within selected genome

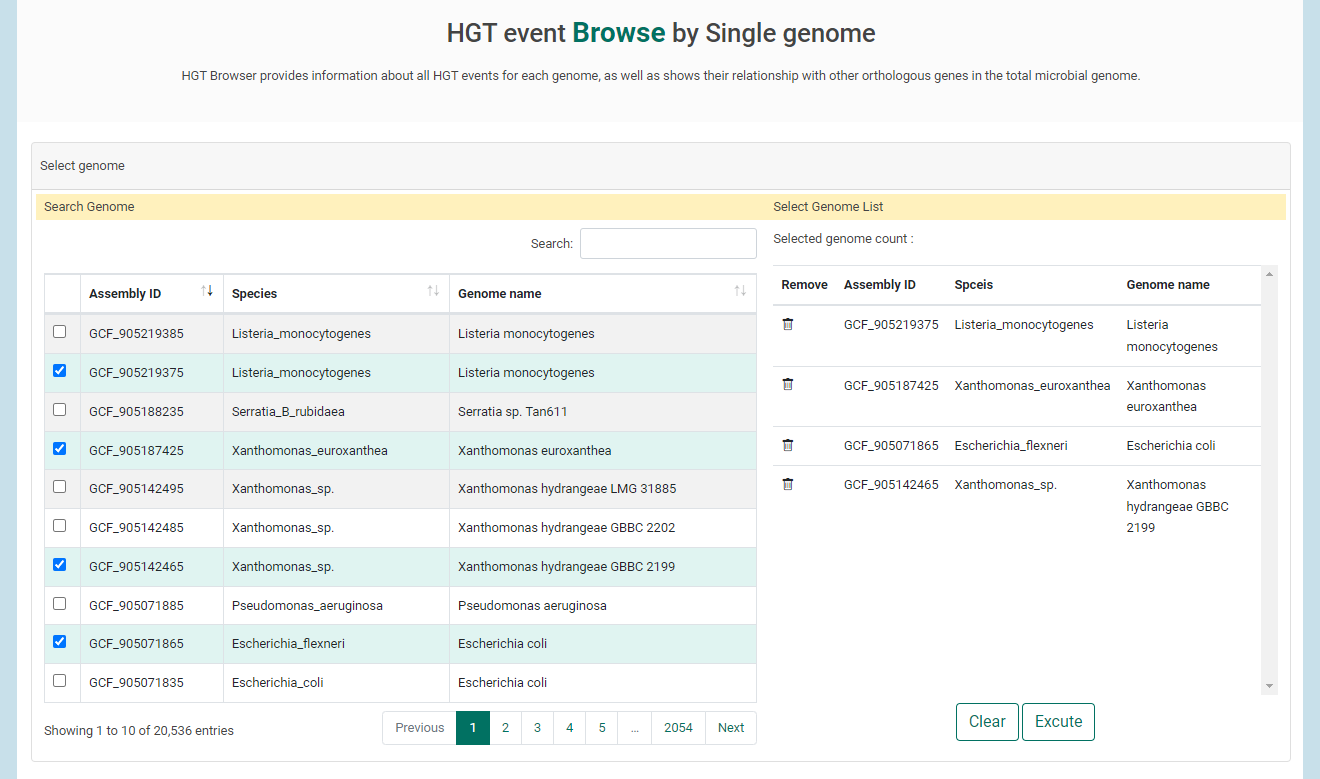
1. If users select a genomes of interest in table, genomes will be listed in right. Once all genomes have been selected, click "Excute" to view HGT results.

2. When users clicked “Excute”, “HGT summary” will be displayed with circos plot. The circos plot can provide an intuitive understanding of the transferring genes by pointing out the gene location with different colors matched with donor genomes. Users can choose the COG clusters, Virulent factor, and Antimicrobial resistance to only illustrate those horizontally transferred genes with corresponding functions.
3. when users clicked “Detail view”, genes are listed by their genome name. Users can see information of donor (microbes who have transferred genes to other microbes) and recipient (microbes who have received genes) genomes for each HGT events.
-between group
1. Choose a Phylum of interest using the taxnomic tree. Click "Analyze" button to do analyze.
2. All HGT events occured between two Phyla are listed up at the bottom of the page.
-Process user query
Information about all estimated HGT events involving user query sequences will be processed. The input sequence must be a genome sequence. The processing time will be !
1. Copy and Paste your sequence into the corresponding input box or upload it using the ‘Choose file’ button.
2. You can modify options such as e-value or query matching coverage, but we highly recommend running analyses using default settings.
3. clicked “Excute”
